The Gap Press Contact and Kit
Please complete the information below to receive press updates on NLIHC's The Gap: A Shortage of Affordable Homes.
The press kit (Google Drive) contains images from The Gap that can be used online or in print. Permission to reprint all or some of the images is granted, provided appropriate credit is given to the National Low Income Housing Coalition (NLIHC). All images are copyright of NLIHC.
For questions regarding media coverage and reprints, please contact Jen Butler, Vice President, External Affairs, [email protected], 202-662-1530 x239.
Images from The Gap 2024
Individual graphics are available below or download all the graphics in English and Spanish (Google Drive).
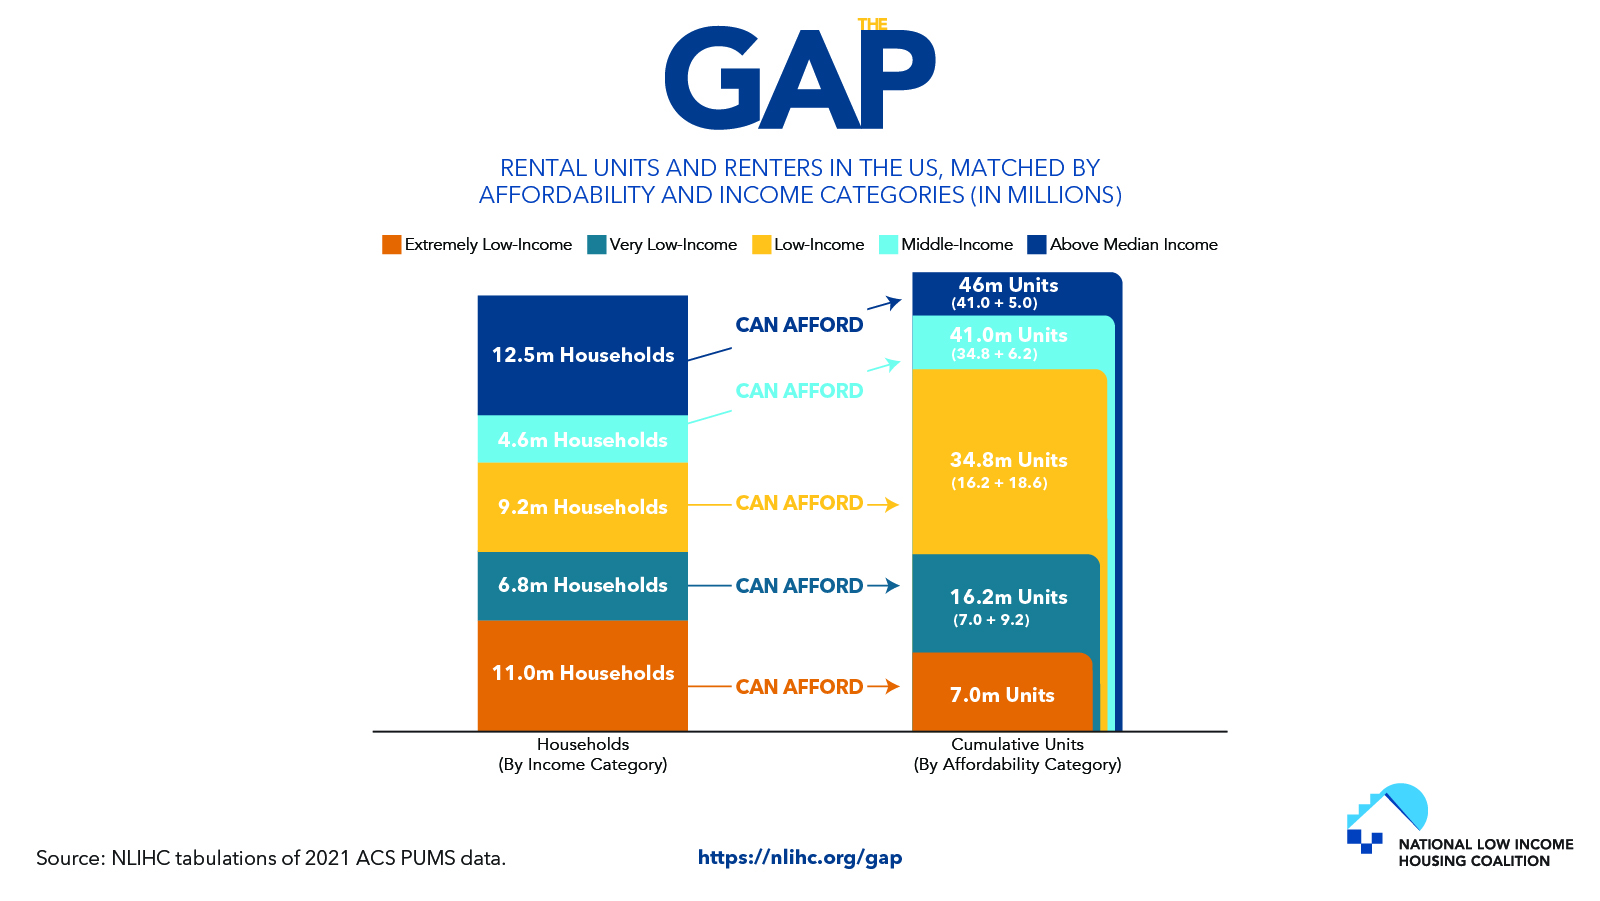
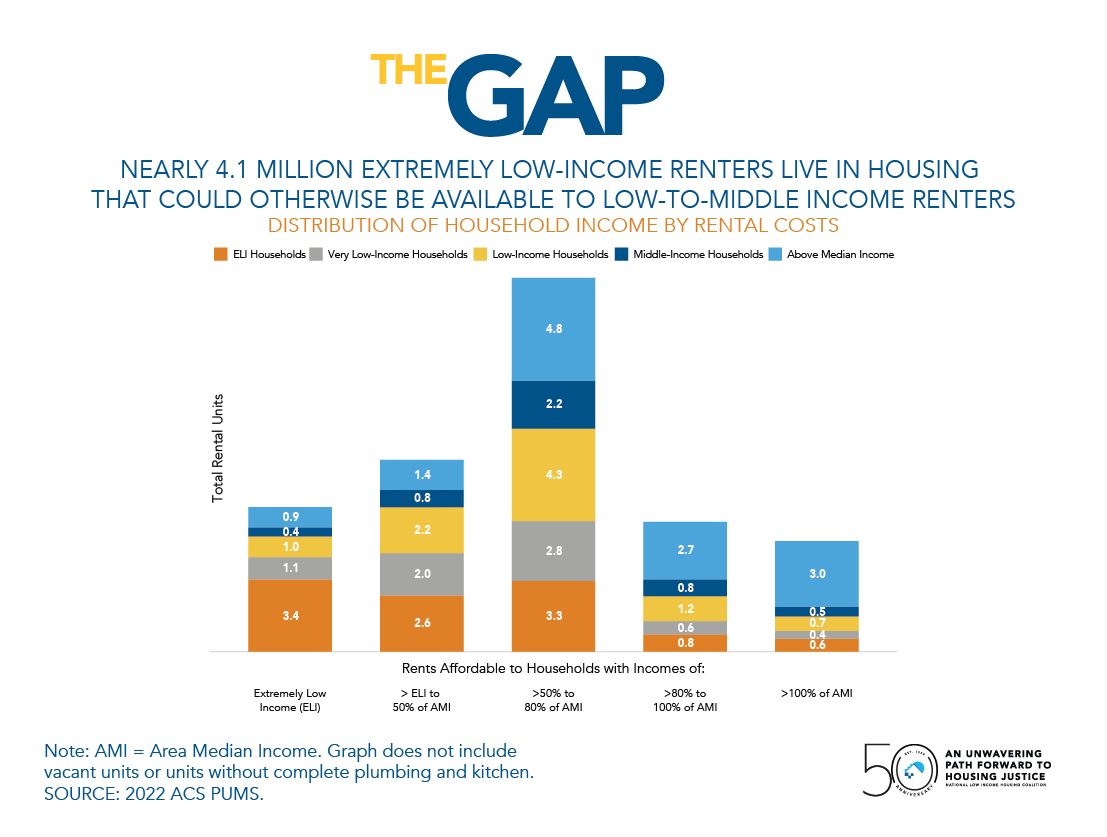
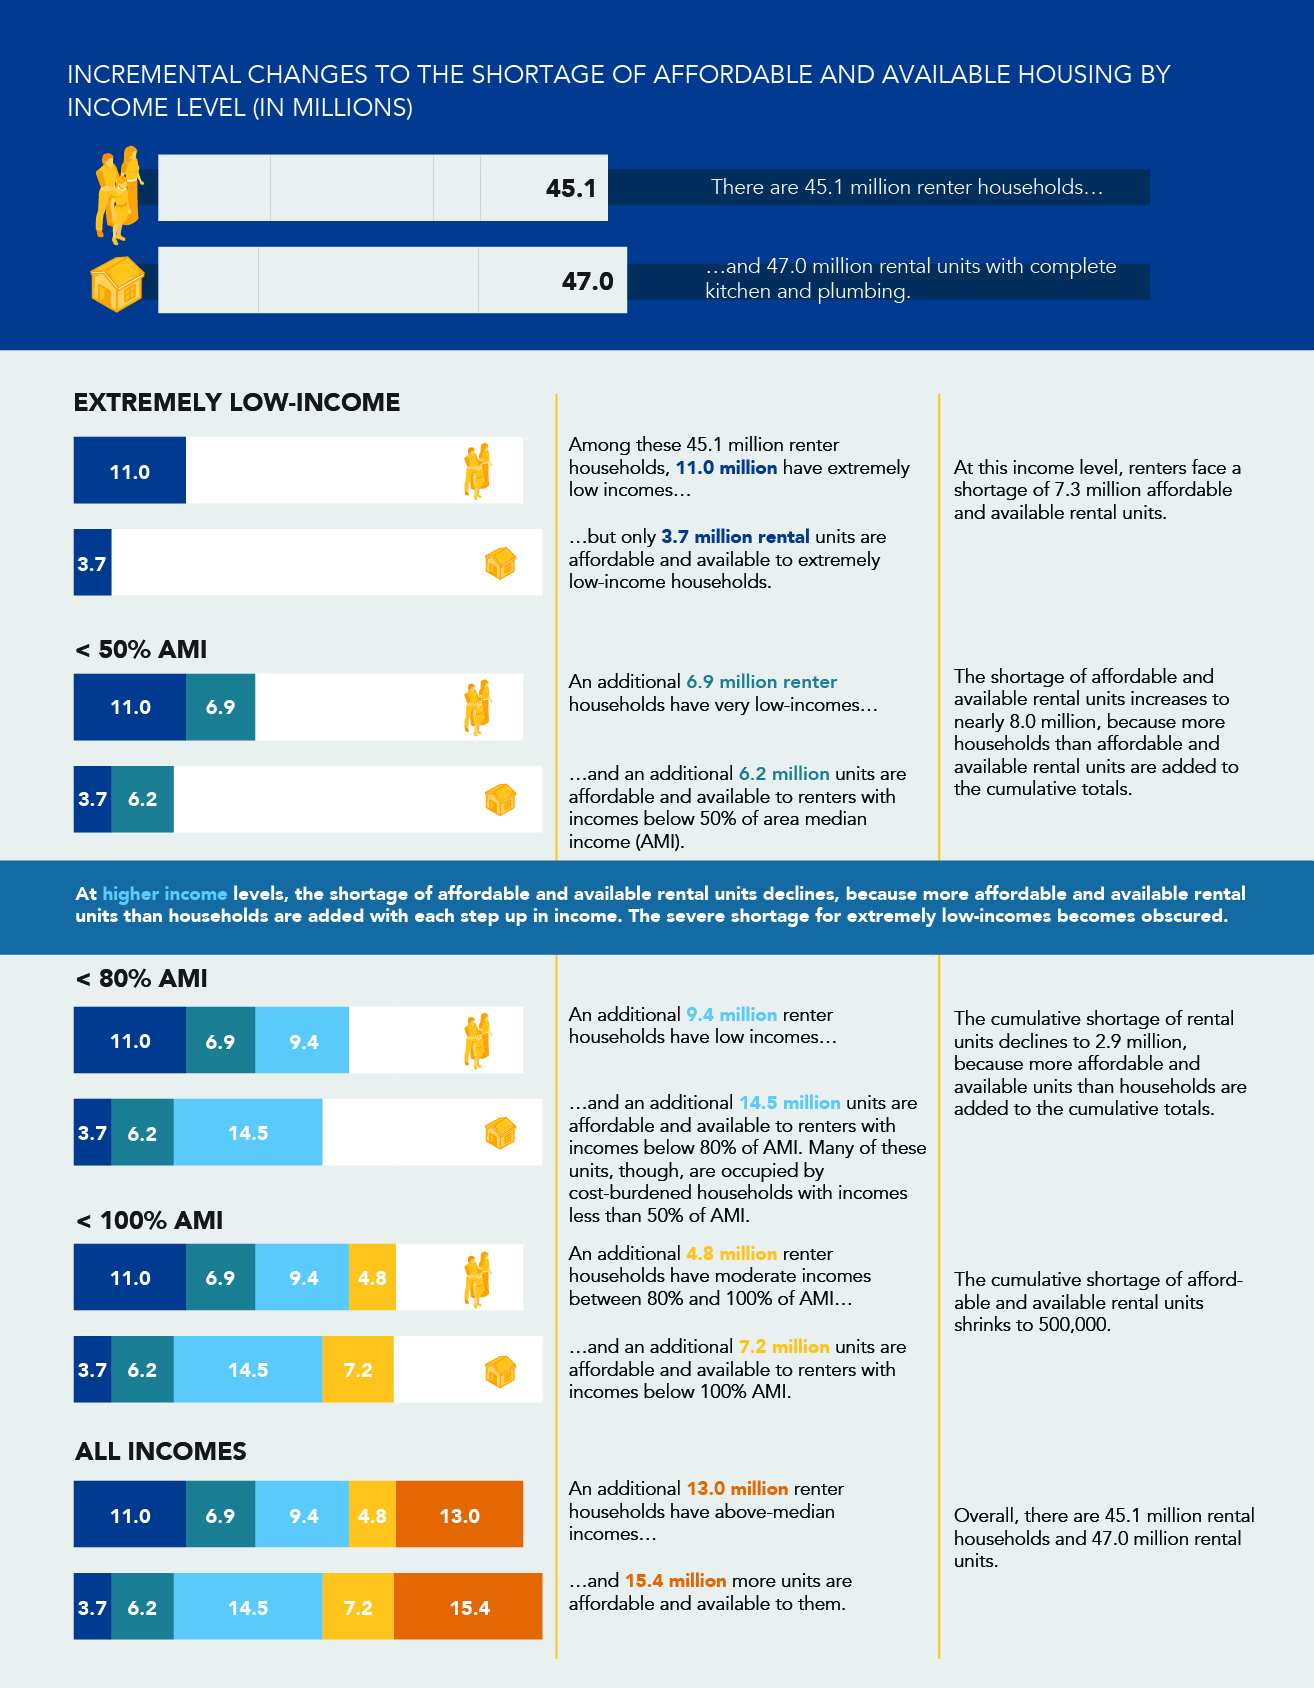
Distribution of Household Income by Rental Cost
Graph showing the distribution of renters by income into rental housing of different affordability levels. Most extremely low-income renters reside in unaffordable housing that would otherwise be affordable and available for higher-income households.
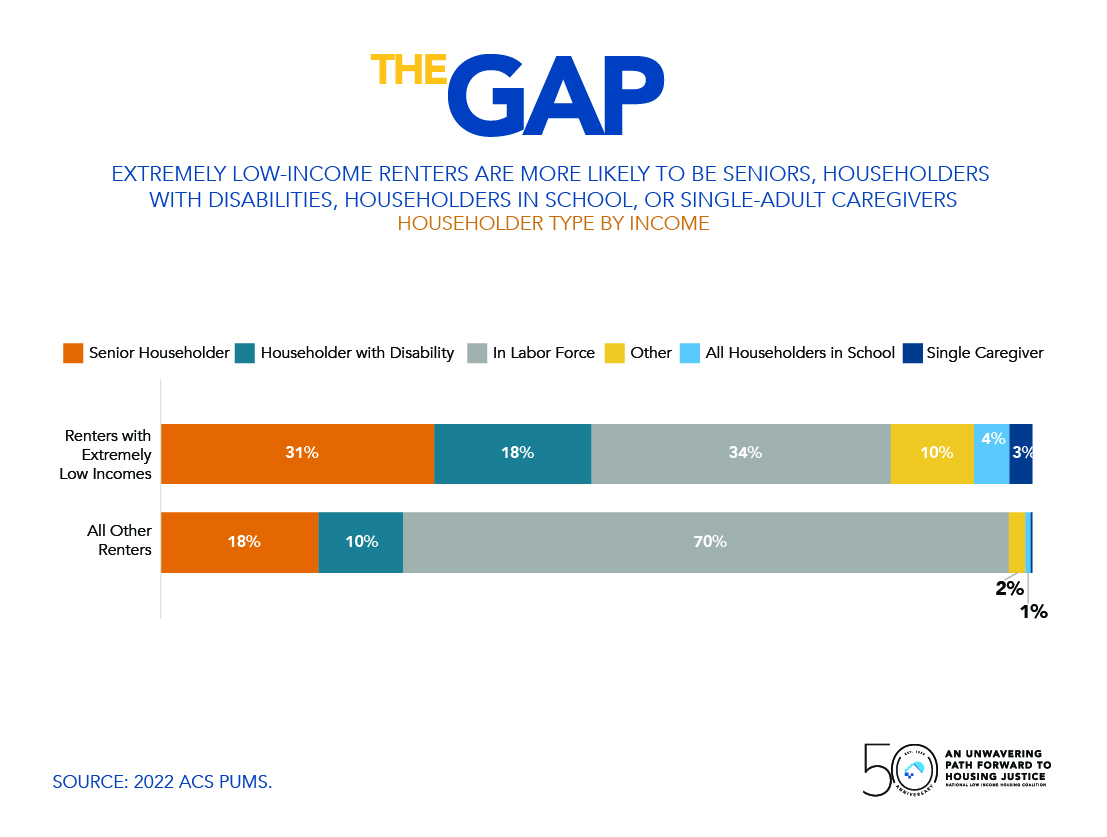
Extremely Low-Income Renter Characteristics that Constrain Income
Extremely low-income renters are more likely than other renters to have characteristics that limit the hours that they are able to work: they are more likely to be seniors, have a disability, be enrolled in school, or be single-adult caregivers of children or individuals with a disability.
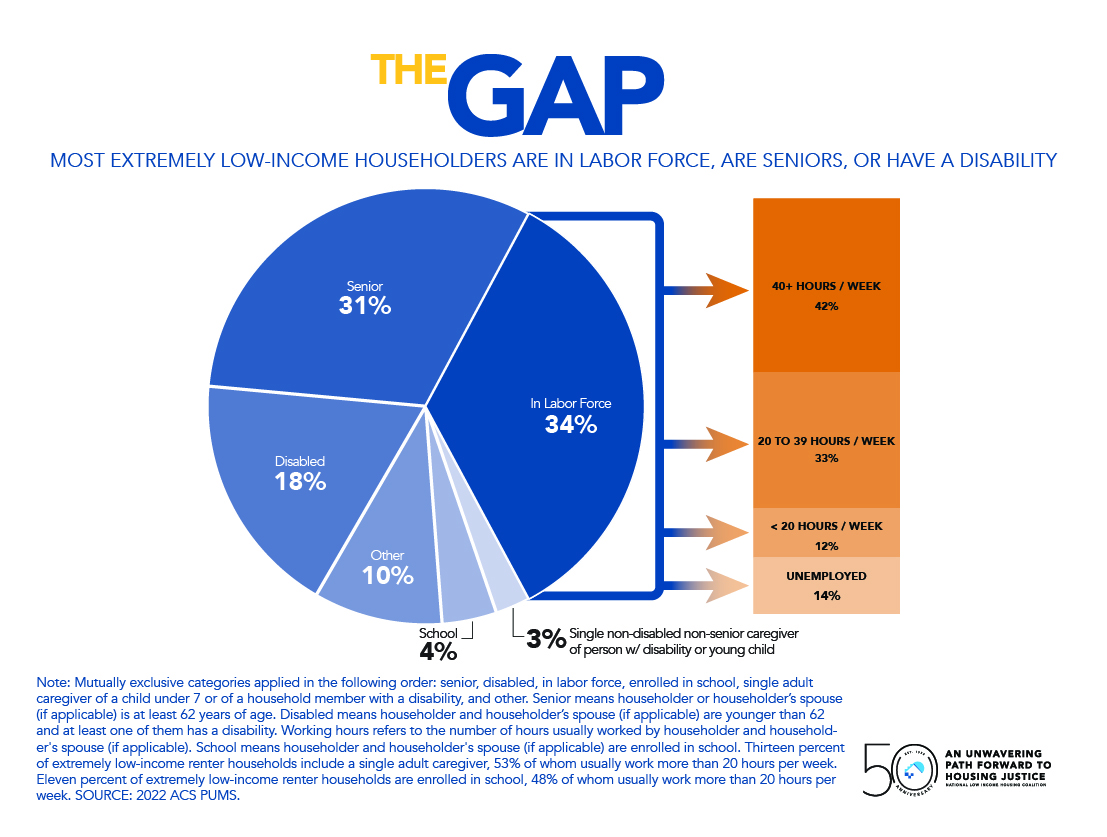
Who are Extremely Low-Income Renters?
Forty-nine percent of extremely low-income renter households are seniors or people with disabilities and another 41% are in the labor force, in school, or single-adult caregivers of school-aged children or family members with disabilities.
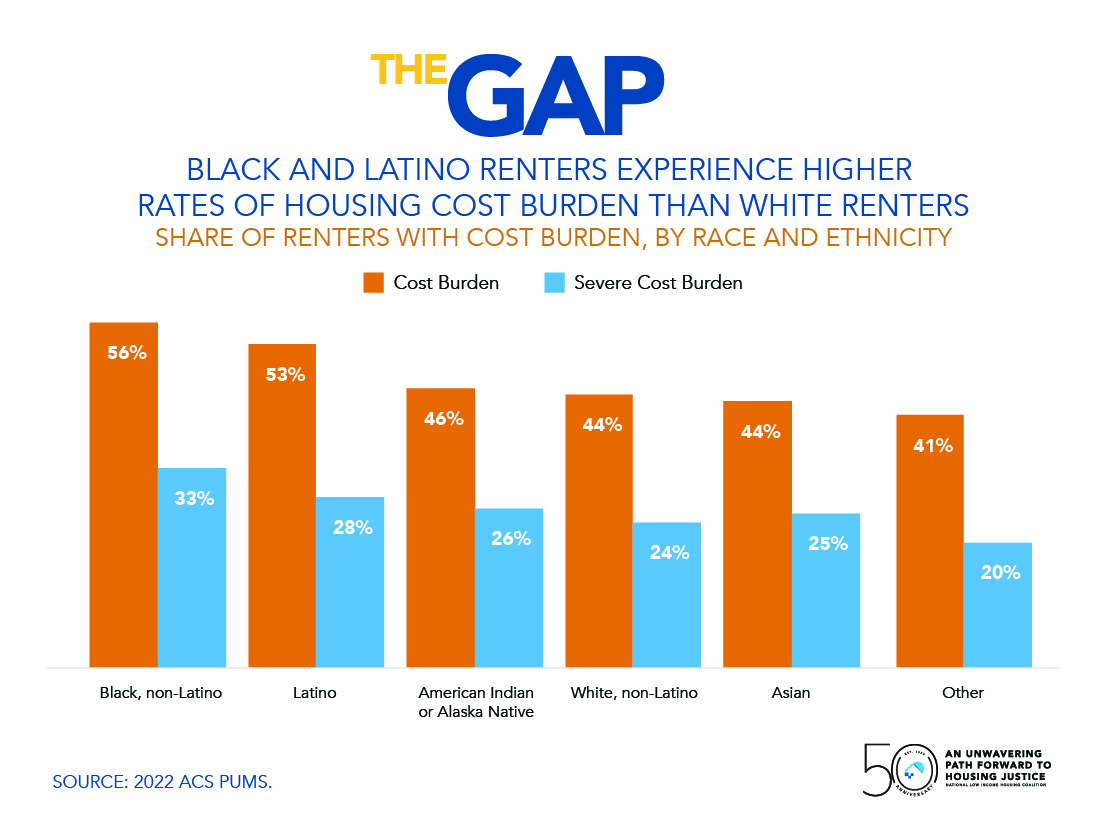

Race and Ethnicity of Severely Cost-Burdened Renters by Income
Black and Latino renters account for 46% of severely- cost-burdened extremely low-income renters. With each subsequently higher income level, they account for a decreasing share of severely cost-burdened renters.